By Dylan Anderson | 26 January, 2021
Okay, you got me. Stability and Donald Trump are not two terms that are usually seen in the same sentence. But overlooking policy, events and Twitter rants, Trump’s presidency characterized a level of stability we have not seen in Presidential history in one way–Approval Ratings.
I present the chart-du-jour so to speak. Below you see the final installment of FiveThirtyEight’s approval ratings of President Trump. What you see is a constant and consistent approval trend line between a high of about 45 and a low of 35. Never in any presidential approval polling have we seen such a stable line like this, and it says a lot about politics, the United States and partisanship.
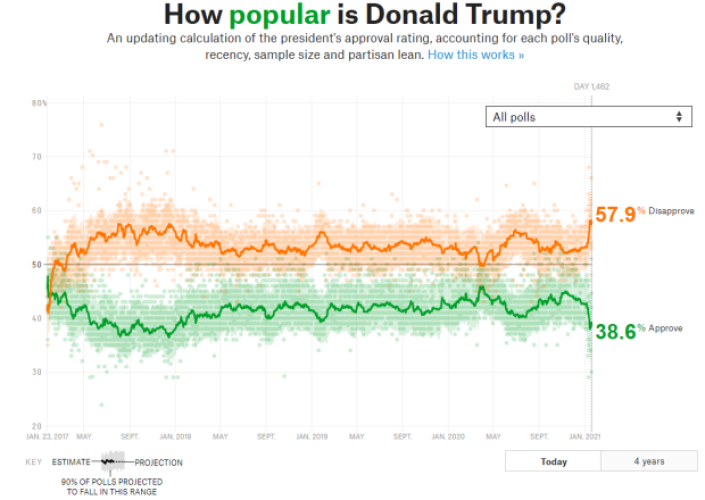
Figure 1: Donald Trump Polling Approval Ratings; Source: FiveThirtyEight
The Significance of Presidential Approval Ratings
Presidential approval ratings are an important measure of how the most powerful person in the world is doing. Well, they used to be. Prior to this generation of hyper-partisanship between the Democrats and Republicans, presidential approval ratings would be a barometer of how the public thought the President was doing. Therefore you would see rating swings based on new policies or life-changing events. Another common feature would be steady declines in approval ratings as Presidents continued into the later years of their term, whether due to fatigue or continued broken promises.
In the last four years (and to a lesser degree in Obama’s presidency), those swings are not as evident and neither are the declines. So what does that mean? Well essentially these stable approval ratings underscore the partisan nature of US politics. If the President is a part of your party, you usually approve of their job, if they are not, then you disapprove. The independents are left to make up the difference, showcasing the small swings seen in the Obama and Trump presidencies.
Looking at past presidential approval ratings, I used historical approval polls from The American Presidency Project and the more recent ratings from FiveThirtyEight to chart the history of approval ratings going back to Roosevelt in 1941 when they began. Note that I did all this in R with the ggplot2, gganimate and magick packages.
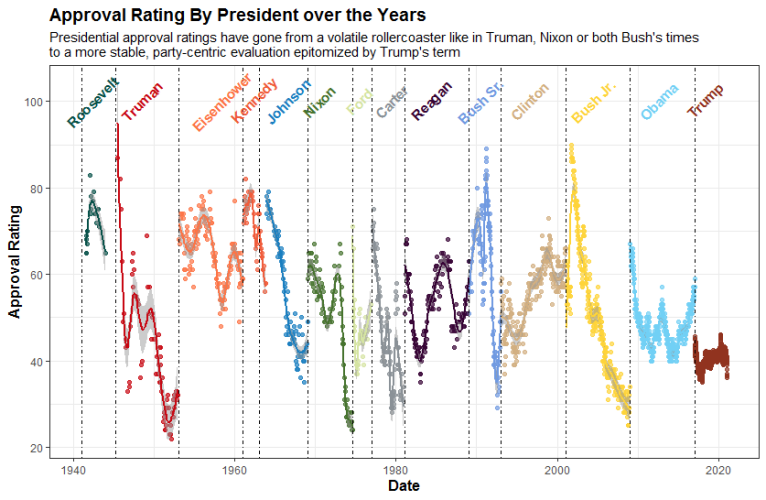
Figure 2: Presidents used to be much more susceptible to large swings in approval, with the population evaluating their job in addition to their party affiliation.
Look at those swings! Truman had a high of 87% which eventually fell to as low as 22%! That difference of 65 percentage points is almost 6 times as much as Trump’s gap from highest to lowest (11 percentage points) and more than twice that of Obama’s (27 points). Okay, so Truman’s popularity swings were very war-time driven, but we still see large swings in almost every president’s tenure prior to the Obama presidency.
The other way to look at this is by the first 4 years in office. Since Trump’s presidency only lasted for four years, its helpful to compare apples to apples. In Figure 3, I built a GIF of how each President’s first four years compares to President Trump’s (except for FDR). What this GIF shows is just how stable Trump’s ratings were as time went on, seemingly oblivious to life events going on all around.
Figure 3: The average President polled much better than Trump in their first four years, with only a few dipping below the 35-40% mark that symbolized Trump’s general support.
Do Political Events Even Matter Anymore?
As I mentioned before, and as several journalists have shown, Trump’s gap in approval ratings between Republicans and Democrats is higher than any president before him. Even Obama had almost 25% approval from Republicans at the start of his presidency, whereas Trump’s Democratic approval never rose above 10%. Although approval ratings have always had a partisan gap, these swings used to be epitomized by large political events that had an impact on all Americans, not just one side or the other.
Let’s show this by looking at a few major political events in the past and how ratings changed. First, the most famous of political events and the associated president–the Watergate scandal and Richard Nixon. As events about the Watergate scandal were revealed to the American public, Nixon went from a relatively popular second-term president to having to resign, a decline in support that was felt by all Americans no matter the political affiliation.
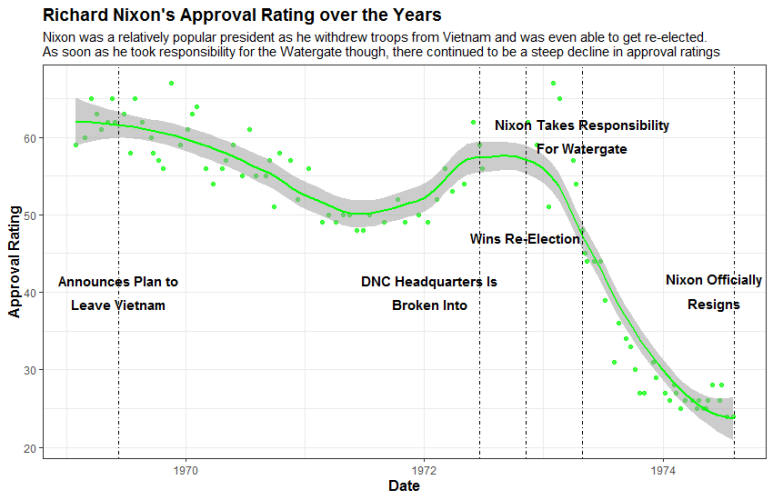
Figure 4: Richard Nixon is a classic case of the negative swings that can take place if a president does something wrong, which eventually led to his resignation.
Another example is the 2001-2009 two-term president, George W. Bush. Bush’s approval ratings were never high, except right after the September 11th terrorist attacks, when all Americans cast aside political affiliation to support their president and his tough stance on terror. Bush also got a little bump when he declared war on Iraq. However, thereafter approval slowly declined as it often does in the later stages of a president’s tenure.
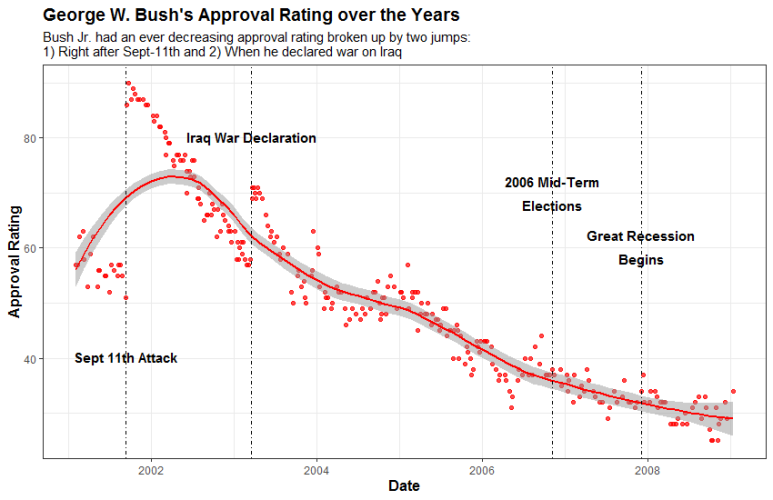
Figure 5: George W. Bush was a polarizing figure, but achieved significant support as president after the horrific 9-11 attacks in 2001.
In Obama’s presidency we start to see a lot less fluctuation. For example, when Osama Bin Laden was finally found and assassinated, Obama only received a 5 percentage point bump, nothing compared to Bush’s 20 point bump after 9/11. In fact, the only real variation came when Obama was campaigning for his second term, showing his ability to draw large support from his campaigns. The late rise in approval is interesting, and may have come due to the dissatisfaction with Hilary Clinton as a presidential candidate or animosity many voters had towards Donald Trump. Who really knows…
Nonetheless, in the end Obama had only a 27 point gap between his highest and lowest approval rating, with a standard variation of only 5.4, the lowest of any president in the dataset (other than Trump).
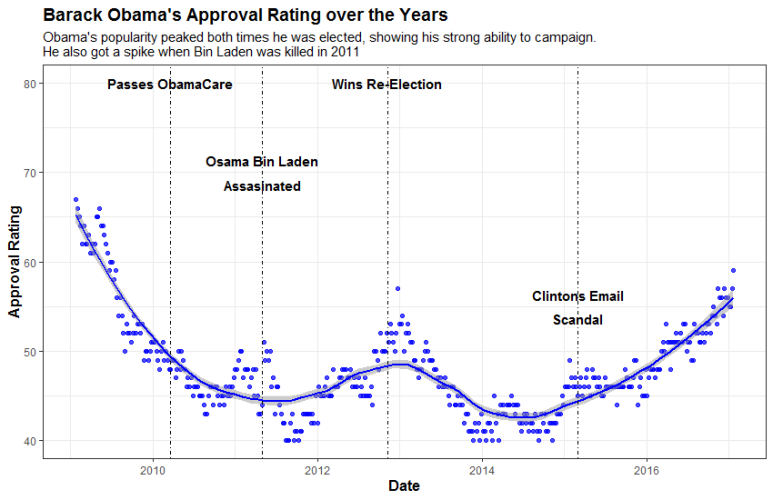
Figure 6: Obama’s approval ratings were buoyed by independents both at the beginning, middle and end of his time as president. Interestingly, his popularity rose as he was leaving office.
Finally, looking at President Trump’s approval ratings, we can see that political events meant very little to his approval rating. After beginning around 45% approval in the country, his numbers quickly dipped and then held steady around 40%. The only real large bump (of more than 3%) was at the beginning of the COVID pandemic, when leaders around the world all saw approval ratings rise. This lowered as it was clear how bad the pandemic would be in the US. Then of course, we all know what happened at the beginning of January, where his approval ratings cratered because of the US Capital riots on January 6th, although the smoothed line does not really depict the deep decline Trump’s support really saw.
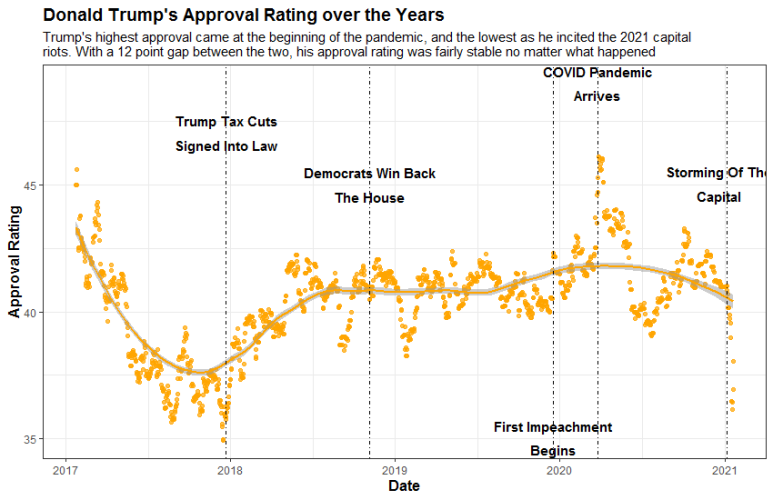
Figure 7: Donald Trump’s approval rate might look like it had swings up and down, but compared with every other president there is little movement in his numbers.
The Lack of Change is in the Numbers
To finish this post, I wanted to highlight the actual numbers behind these charts and graphs. In Figure 8 you see a table that epitomizes everything we have been talking about. The most apparent gap between Trump’s presidency is the lack of volatility, with a standard deviation of 2% (meaning the majority of approval ratings hover 2% around the mean on both sides).
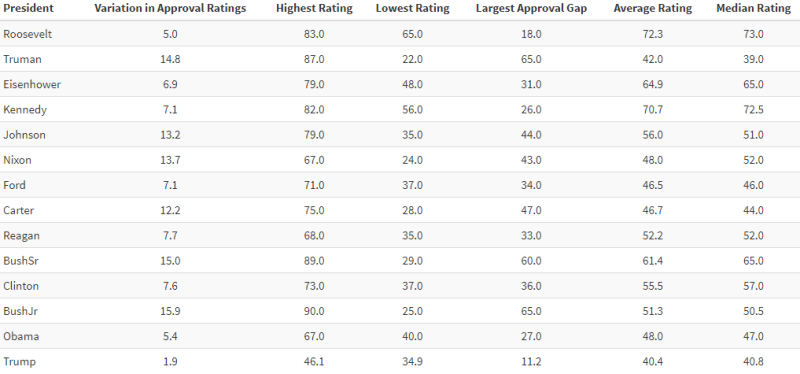
Figure 8: It is always helpful to look at the numbers behind any chart and come to your own conclusions!
Standard deviation is a bit skewed given Trump has a ton of approval poll data points to associated with his ratings (creating a lower standard dev). Therefore, I also show his gap between the highest and lowest levels of support in his presidency, which is a fraction of any other president at around 11 points. The next closest is Roosevelt (who had overwhelmingly high war-time support over a short period of time that the ratings existed) and Kennedy (who had a very short-lived presidency, therefore less time for volatility).
General Takeaways:
No matter how you slice it, there is lower volatility in the last two presidencies than in any we have seen before, likely driven by increased political polarization
After all is said and done, President Trump probably had the least popular first-term in the past 75 years
It will be interesting to see if this lack of volatility continues into Joe Biden’s presidency
References:
[1] FiveThirtyEight, Donald Trump Approval Ratings, (2021)
[2] The American Presidency Project Presidential Job Approval, (2021)
[3] Dunn, Amina. (2020). Trump’s approval ratings so far are unusually stable – and deeply partisan. August 24. Pew Research
I am a Simulation & Strategy Consultant at Monitor Deloitte, I use stats and analytics to inform Digital Twin models that re-invent the way companies approach strategic decisions. In my free time, I’m obsessed with politics and policy, blogging about it all the time at Policy In Numbers. You can find me there or at my LinkedIn and Twitter accounts (feel free to connect or give me a follow).